In both articles Keith makes a special effort to thank and commend the countless individuals, seen and unseen, who helped run UKNOF over the years and make it what it was.
I am deeply grateful to Keith for acknowledging these contributions.
On my account, I’ve acknowledged, aired and feel able to move on from the feelings of bitter disappointment about what’s come to pass, and instead I’m ever closer to the “smile that it happened” state of mind.
I might continue to grieve for a little while – and in a healthy way – for the UKNOF that was, at the same time I do want to see whatever succeeds it to actually succeed.
To try and make use of the legacy left behind by 20 years (!) of UKNOF and do right by the contributors and community. To take forward the best bits of UKNOF as its foundation.
To enlighten, grow friendships, develop careers, to build networks beyond infrastructure.
So in the coming days I’ll look to the future while at the same time trying to tell some of the UKNOF story, “the best bits”, from my own perspective.
Maybe for my own peace of mind, but also maybe for the success of what’s to come.
After all, there’s 20 years of learning experiences. I was there for a lot of it…
It’s going to take me a while to get my thoughts and words in order on this subject. It is one which is quite emotive for me, for reasons which will become clear. I don’t think I can get this all out, organised in a single post either. So this may be the first of several things I write on the subject.
UKIF has left the building. <thud>
The organisation that ran UKNOF events – UKIF Ltd – has stated they will no longer run the events, and will be winding the company up in 2024.
They state a number of reasons for this, including declining sponsorship in the present macro-economic climate, reduced attendance, and the costs of continuing through Covid. All of these have served to deplete the organisation’s reserves, because while the events did not cover their costs the long term commitments to venues, some made before Covid, had to be kept – UKIF would have had to pay something whether or not the events in 2023 went ahead.
Another reason is the forthcoming retirement of Keith Mitchell, the principal in UKIF Ltd and the founding convener of the UKNOF meetings, without any obvious route for succession.
While reminiscing about the WCML operations with folks on Facebook and elsewhere, it struck me that while a lot of attention was paid to the locomotives, less was given to the train formations – but this was something that I did pay attention to. So, I thought I’d spend a bit of time documenting what I remembered and recorded from the era as I dig through my own memories and archives.
This is likely going to be the first article in a series...
Pre-1990, it was common for some of the Anglo-Scottish Intercity trains on the WCML to split en-route – often at Carstairs, where a portion would be detached to serve Edinburgh, while the remainder went forward to Glasgow. The formations on these workings were known as “half-sets” – in the sense they were about half the length of a more normal train consist, and two put together provided the more usual number of seats for a WCML train.
It was more usual for trains which started at locations other than Euston to split portions, so for me this timetable stands out for having these half-sets which worked to Euston, and the variety of services these sets covered raises an eyebrow!
This subfleet was based at Manchester Longsight and used air-conditioned Mk2def coaches: Brake Second Open (BSO), Tourist Second Open (TSO), and First Corridor (FK).
There were a total of 12 diagrams, MA275-MA286, all formed BSO-3x TSO-FK.
Where provided, catering was rostered for Mk1 RBR vehicles, usually in the middle of a train – sandwiched between the two half-sets – working their own circuits in the MA5xx range.
The Carriage Working Notices and other marshalling data showed that the FKs ought to both be next to the RBR where present. This means that the sets sometimes needed to be turned – usually at Glasgow (where the ECS between Central and Polmadie would include a reversal at Shields Rd), or Edinburgh (which used a triangle in the Abbeyhill area).
Services worked included:
Euston – Inverness “Clansman”
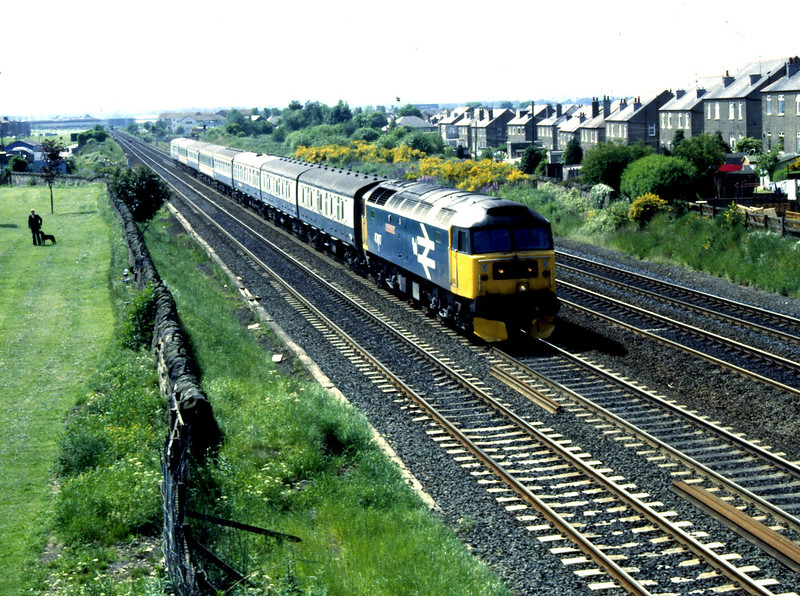
1M42 Up “Clansman” nears Edinburgh – the front two NEX full-brakes are on Scottish Internal circuits and come off at Waverley , when the main part of the set is pieced up with the half-set on MA275 which is waiting at Edinburgh having worked North from the West Midlands on 1S53. The inconsistency of the era is clearly visible, the FK is not air-conditioned, just a Mk2c pressure-vent, as is the BSO at the extreme rear.
Euston – Stranraer boat train
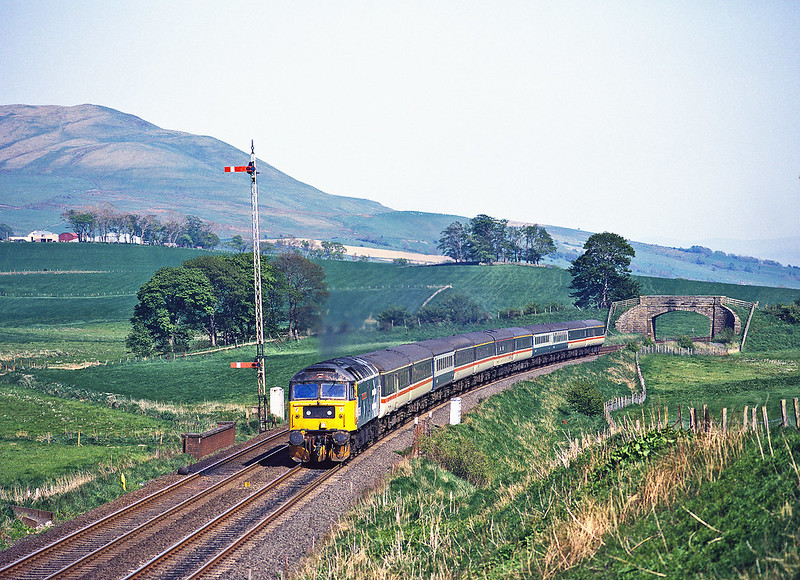
A pair of Longsight half-sets working MA280/MA285 diagrams behind 47595 on the GSW with 1S74 Euston-Stranraer
The morning Birmingham New St – Glasgow/Edinburgh
A mid-morning Manchester – Glasgow/Edinburgh
The balancing Up workings of the above were much less straightforward!
An early morning Wolverhampton – Euston service and an evening return – this stands out as being one of the few “EBW” services not worked by the Oxley-based fleet.
Seated portions of the Euston-Stranraer sleeper and Barrow-Euston sleeper!
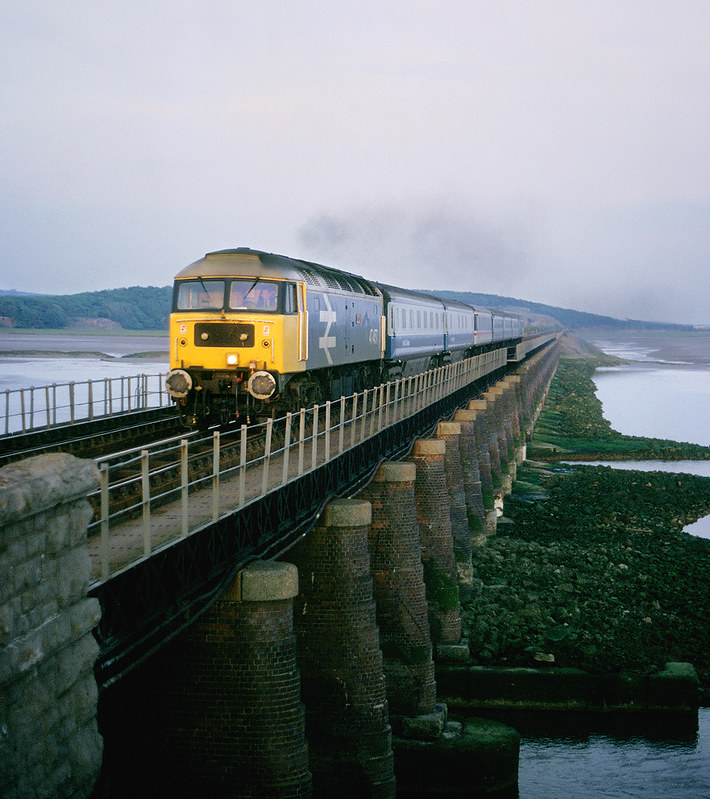
The Longsight half-set working MA278 diagram is behind the Mk3 sleepers on 1P10 Preston-Barrow. The sleepers will have worked up from Euston on the front of 1P38 “Lancashire Pullman”.
The amount of variety and how the portions cycled around the work was quite something.
The fleet was used quite intensively, some diagrams were quite complex, with very little in the way of “out and back” work.
Despite calling Longsight their “home” depot, only two half sets a day worked back to Manchester for overnight stabling, Oxley and Wembley seemingly playing a bigger part in overnight stabling and servicing.
The quality of the vehicles could be quite variable as well – some refurbished, some not, and substitutions with “fresh air” Mk2abc stock not uncommon. The substitutions could persist until the set next cycled through Longsight.
This was quite a downgrade from 1986 for both the “Clansman” which benefitted from refurbished Mk3a stock, and 1S53/1M47 “Midland Scot” that saw some of Oxley’s first Mk2f refurbishments deployed captive on OY275/276 diagram.
Using the LMR Carriage Working Book from 1987, I’ve reconstructed the Monday to Friday diagrams:
MA275 ECS Oxley – Birmingham NS 1S53 0725 Birmingham NS – Edinburgh RP (with MA276/MA500) 1M42 1438 Edinburgh – Euston RP (1030 ex-Inverness, with MA282/MA505) Forms MA279
MA276 ECS Oxley – Birmingham NS 1S53 0725 Birmingham NS – Glasgow C FP (with MA275/MA500) 1M87 1550 Glasgow C – Manchester V FP (with MA501/MA278) ECS to Longsight Forms MA278
MA277 ECS Longsight – Manchester V 1S49 1025 Manchester V – Glasgow C FP (with MA501/MA278) 1M47 1750 Glasgow C – Birmingham NS FP (with MA500 throughout/MA283 attaches Carstairs, detaches Preston) ECS to Oxley Forms MA284
MA278 ECS Longsight – Manchester V 1S49 1025 Manchester V – Edinburgh RP (with MA501/MA277) 1M87 1544 Edinburgh – Preston RP (with MA501/MA276) 1P10 1940 Preston – Barrow (with WB573) 1K12 2149 Barrow-Stafford (with WB573, detached at Stafford) ECS to Oxley Forms MA283
MA279 1M06 1055 Stranraer – Euston RP (with MA502/MA286) 1G47 2110 Euston – Wolverhampton FP (with MA502/MA286) ECS to Oxley Forms MA276
MA280 1S74 1000 Euston – Stranraer RP (with MA503/MA285) Forms MA286
MA283 ECS from Oxley 1A72 0556 Wolverhampton – Euston RP (with MA284/MA504) 1S59 0855 Euston – Edinburgh FP (with MA284/MA504) 1M44 1744 Edinburgh – Manchester V RP (with MA500/MA277 to Preston) ECS to Longsight Forms MA277
MA284 ECS from Oxley 1A72 0556 Wolverhampton – Euston FP (with MA283/MA504) 1S59 0855 Euston – Inverness RP (with MA504, MA283 detached Edinburgh) Forms MA282
MA285 1S74 1000 Euston – Stranraer FP (with MA503/MA280) 1M14 2225 Stranraer – Euston RP (with WB555) Forms MA281
MA286 1M06 1055 Stranraer – Euston FP (with MA502/MA279) 1G47 2110 Euston – Wolverhampton RP (with MA502/MA279) Forms MA275
These diagrams and arrangements only existed for 1987/88, and didn’t persist.
The Clansman went over to a Wembley based Mk2f rake in May 1988, the operation again interesting in itself, being another half-set arrangement with a portion for Aberdeen, and “curious” buffet cars for trains out of Euston. Some of the portion working splitting at Carstairs started to be reduced, and most of the non-Euston related work was covered by an enlarged Polmadie fleet and slightly simpler Longsight duties – effectively one of the early hints of things to come with sub-sectorisation.
Some of you will be aware I’m a remote worker. My employer’s corporate HQ is in the US, our EMEA HQ is in London, while I’m nominally on a “work from home” contract, where home is in Manchester. I work with an International team, based all over the world.
The lease on our London office expired recently, and the company took the decision to move our EMEA HQ into a dedicated private office space in a WeWork building – I’m assuming folk reading this know what a WeWork is, if you don’t, it’s a serviced office, but just not beige throughout.
The upsides to being located in a WeWork are pretty good.
Modern offices with up-to-date decor, meeting rooms of various sizes, on-site WeWork staff to handle all the faff such as maintenance, cleaning, etc., for you, including a mail-room function so you never have to wait in for a parcel again, and all the fun things more usually associated with massive tech companies and start-ups, such as espresso machines, table football, free beer in the afternoons, etc.
The things you might expect at a Corporate HQ location, but now available to people working in the smaller satellite offices too.
So much so that we’ve done that with a number of our smaller regional offices of late. So we do put significant business (for us at least) in WeWork’s direction.
Because I had access to our old London office, that meant I became a member of the WeWork building we moved into in London. This means in WeWork’s eyes, our London EMEA HQ office is my “home” location. I have 24×7 access there. I need to come and go from there for face-to-face meetings and the like, so that makes sense. All well and good.
But you’ll remember, I live in Manchester.
As it happens, there are two (soon to be three) WeWork locations in Manchester.
I can spend 1 credit (a credit is how WeWork account for additional services, such as booking meeting rooms, and use of non-“home” workspaces) from the company WeWork account to book a “workspace” in one of the Manchester locations for the day, and sometimes I’ll do that, so I don’t go berserk working from home and staring at the same four walls all the time.
Yes, outside! People! Conversation! Change of scenery! Free coffee! Free beer! Air-conditioning on sweltering days!
Sounds great that I can use my company WeWork membership to get access to the more local facility and get out of the house, doesn’t it?
I’ve been trying this for a couple of months, I’ve found there are some downsides:
The “workspace” you get for your WeWork credit is basically a form of guest access to that building’s communal areas. These are areas with the kitchen, barista, coffee machines, foosball tables, ping-pong, background music, and beer.
So, unlike the amenity of your home location – proper desk, proper work chair – for your credit you get access to some sofas, high tops, and if you’re lucky (because it’s location dependent) some desks intended for short term use (i.e. tables and non-adjustable hard chairs). The good spots – with the more comfortable chairs and power outlets – are a) often more “cafe style” and b) coveted, tending to go really quickly.
Also, because you’re in the communal area, you’re basically using the same space that the building’s resident members use for coffee breaks, to eat their lunch, chat, and have informal meetings which means it can get loud.
Finally, because you’re not a regular user, you’re basically left feeling a bit like this rando that’s invading the other peoples’ space. You don’t really feel like you belong.
Bluntly, working as a visitor in a WeWork other than your company’s own location is actually not a great work environment if you need to concentrate, or intend on spending any length of time there.
It’s fine for short-term getting online, grabbing a coffee, checking emails, and maybe the odd informal meeting or chit-chat, or just a change of scenery – basically the things you might otherwise do in a coffee shop.
The other problem is that unlike one’s “home” location, your credit only buys you access while the WeWork location is staffed – 9-6pm. It’s also an “automatic lock-in” – very much like the cult Channel 4 gameshow The Crystal Maze, but far less entertaining when you nip out to the loo and your keycard is automatically deactivated. You’re on one side of the door, while all your stuff is on the other, and now you’re looking for someone to let you back in.
This becomes a challenge when you’re working across multiple timezones where conference calls running into the evening – especially in that 4-7pm sweet-spot where the time isn’t hugely anti-social in California, Boston, and the UK – aren’t unusual. Work days just don’t routinely finish at 5.30pm anymore!
Now this is where I believe WeWork – as a huge global co-working organisation, with offices all over the place – ought to understand this better, and are missing a trick with remote workers such as myself: people who do need access to their organisation’s corporate office, but at the same time may have a WeWork closer to their home location that they might like to use once or twice a week, and somewhere they feel they have a connection with.
Indeed, WeWork consider their “Global Network” as one of their upselling points, but the way it’s organised at the moment, each individual location feels like a separate “franchise” of WeWork. My opinion is this is where the Global Network falls down.
What would I propose they offer people such as myself?
The ability to nominate a “secondary location” – this would be your choice of WeWork closest to your home, space permitting – at which you have 24×7 walk-in privileges, other benefits as though it’s your home location, and access to the communal areas (effectively this is an “add-on” Hot Desk membership at the chosen secondary location).
The ability to book a “proper” desk in an open plan area or small (1/2 person) office at your nominated secondary location on a day-to-day basis using credits – effectively the same as you can book workspaces or meeting rooms now, except it’s at an actual desk, with an actual work chair.
Yes, I propose that WeWork deliberately hold back a handful of small offices and open plan desks in each location, and set them aside for upgraded hot-desking.
How many credits would a desk cost? The cost of a UK WeWork credit is £20 (I know it’s $25 in the US).
Most co-working spots I know of that offer an “occasional user” membership (i.e. aimed at 5 days a month, but not religiously policed, could be 8-10 half-days) will charge around £100-120+vat a month, but for that you do get a proper desk with a proper chair, and you’re not working out of a sofa or from a high-top in a corridor all day.
At WeWork, the closest thing that gets you a proper desk is a Dedicated Desk plan, and those currently run to £330/month in Manchester, they are more expensive in other locations. If you assume 22 days per average work month, it’s £15/day. (Or 261 work days in 2019, so 330×12/261 = 15.17)
So let’s say that 0.5 credit will get a “secondary member” a proper desk in the open plan office area for the day. Remember, your organisation is already paying WeWork a small fortune back at “home base”, so why shouldn’t they get a good deal in the other branches?
What about a private office? In Manchester these start from £460/month, depending on which building.
I’d suggest private offices are offered from 1 credit per seat for the day in cheaper buildings and maybe 2 credits for the busier and more expensive cities and buildings with higher demand.
I know I could technically book a small meeting room, but again these aren’t intended for you to get dug-in for a full day’s work. They are designed around being comfortable for relatively short periods of time, and encourage turnover so other WeWork members can use them. Plus, using them during peak hours chews through credits.
So that’s where I think WeWork are dropping the ball the most, at least for annoying people like me with non-conventional work locations and patterns.
I’ve not even gone into detail here about their online systems and app, through which you do have access to their “Global Network”. Despite the growth of WeWork, it’s still centred around the assumption that you’re really only interested in and attached to one building (and therefore one WeWork “community”) at a time – which enhances the feeling of being a bit of a rando if you’re in a WeWork other than your “home”, or if you change to follow your “secondary” location means you become disconnected from your Company’s main base.
As ever, please leave a comment, or tweet me with your thoughts: Are you a remote or nomadic worker that occasionally needs a good bolt-hole? Are you disappointed by the WeWork “global” offering? Are you aware of some “secret menu” of WeWork membership that does exist and will actually do what I’m looking for?
The saga of the May 20th UK railway timetable changes continue. Modified services remain in place on the Northern network, still fewer trains are running than before the May timetable change, though a reinstatement of Rest Day Working for Drivers and a temporary timetable has stabilised things somewhat.
In an amazing show of “can-do”, West Coast Railways – the Carnforth-based people who ran the Hogwarts Express for the Harry Potter films, as well as some splendid rail trips with steam locomotives – worked with Westmorland and Lonsdale MP Tim Farron to manage to return trains to the Lakes Line to Windermere, which hadn’t seen a train for two weeks.
Fantastic to see a trial run of actual trains on the Lakes Line today. Been proud to work with West Coast Railways & local rail groups to get this off the ground. We're now in a position where a shuttle service could be running from tomorrow- the ball is firmly in the DfT's court pic.twitter.com/giFyAS4A4O
Meanwhile the heads of the involved TOCs and their planning subject matter experts, and colleagues from Network Rail, have been required to give evidence in front of the House of Commons Transport Select Committee.
You can see the full session – almost 2 hours and 30 minutes – at parliamentlive.tv.
What was clear from the evidence is that the entire UK Rail Industry and various Governments had a part to play in letting us down, and worse still, no one person has executive responsibility, even to act on massive red flags.
The existence of the temporary service on the Lakes Line has even focused Northern’s mind it seems, because they’ve now said they expect to return Northern-operated trains to the line earlier than originally anticipated, Northern MD David Brown giving a date of 2nd July to the Committee.
They obviously didn’t much like being shown up by a heritage rail operator.
But back to the Perfect Storm…
A number of conditions came together to cause the chaos wreaked on us since 20th May:
Late handover of planned infrastructure improvements: In particular the Preston-Blackpool resignalling and electrification. This work didn’t just put up overhead wires, but replaced all the signalling, changed the positioning of junctions and the entire layout of Blackpool North station. This section of line was effectively a new railwayand drivers needed to re-train on the route.
Failure to deliver other key infrastructure improvements: The electrification via Bolton to Preston is now delayed until the end of the year. This project has suffered multiple setbacks including the lead contractor withdrawing from the work back in 2015 because they said it would overrun, the replacement contractor (Carillion) going bust, and issues with ground stability (discovery of pockets of sand and abandoned mine shafts). This project will be almost two years lateif it is delivered at the December timetable change as currently hoped.
Unavailability of promised trains: Northern required a number of extra trains if the 20th May plan was to work properly. These were not new trains, but were being made available through something known in the railway industry as a “cascade“, new trains being delivered elsewhere displace trains to other services. Northern were expecting to get additional trains, compatible with their existing fleets, from Scotland and the South West, however this cascade has failed due to delays in the introduction of new trains. In Scotland the trains are having to be modified because drivers have complained about the visibility through the curved windscreens – likening it to “driving a goldfish bowl”. As a result only a tiny fraction of the expected extra carriages were available.
Ongoing labour relations issues in Northern, and this is an area which deserves further explanation in itself.
Why are Northern short of trains now?
This relates to the “cascade” that I eluded to above. Think of the cascade as one of those tile games with one empty square.
The plan was to move trains from Scotland and the Plymouth and Cornwall areas to Northern in time for May 2018. With the odd exception (Class 170 units), these would be stock that are technically identical to that which Northern already have in their operation (Class 150/1, Class 158, Class 319), thus easing requirements for crew training and route-clearance.
However to create the “empty square” that allows the cascades to happen, we had dependencies on four projects:
Completion of Paddington to Reading electrification
This allows roll out of Class 387 electric trains on Thames Valley suburban services between Reading and Paddington.
This permits release of Class 165/166 “Turbo” units to move within GWR from the Thames Valley suburban network to the Bristol area.
That allows a cascade of trains within the GWR franchise such that it releases a number of 150/1 “Sprinters”, which already work in the Northern area, to Northern.
Edinburgh-Glasgow electrification and roll out of Class 385 Hitachi trains
The line has been electrified to plan, but the Class 385s are delayed due to the “goldfish bowl effect” of the curved windscreens.
This has delayed release of some Class 158 and Class 170 units from Scotland to Northern.
Surplus electric trains have recently been drafted in to Scotland to cover the gap, and hopefully allow some more trains to move to Northern.
Late delivery of upgraded High Speed Train sets, themselves cascaded from GWR by IEP introduction, to Scotrail long distance services
This would release further Class 158 and 170 units to Northern.
The release of the HSTs from GWR was delayed by slow introduction of the IEP and delays to the Great Western electrification.
Non-delivery of Class 769 Bi-Mode “flex” units
Converted from Class 319 units by addition of diesel engines so they can operate away from the wires.
Made necessary by Government’s indecision on electrification of NW secondary routes such as Oxenholme to Windermere.
The prototype has yet to complete testing and be signed off.
Northern was meant to have over 60 additional trains delivered in time for May, including being handed over early enough to allow for crew training on types new to Northern (such as the 170 and 769).
Instead they got less than 30.
Who controls what stock is used and where? To a large extent, despite rail privatisation, there is not really a “free market” for rolling stock. While stock may be privately owned by banks, trusts and investment companies, much like aircraft leasing, the types of stock and the disposition are largely co-ordinated by the Department for Transport.
Northern is not a unified company
While “Northern by Arriva” might be the brand, and there is one company at the back end, Arriva Rail North Ltd, operationally it is a more complex animal.
Northern is effectively a mash-up of some component parts of previous rail franchises.
Remember First North Western? Remember Northern Spirit (this was Arriva’s previous, and similarly disastrous attempt at running trains in the North)?
15 years ago, the decision was made by Whitehall Mandarins to strip out the long distance routes from Northern Spirit and make a separate “TransPennine Express” franchise, which had aspirations of being more an “Intercity” operator and less of a local operator. Some routes from the old First North Western franchise (such as fast trains from Blackpool or Barrow to Manchester Airport) were also transferred into TPE, in addition.
Once the North Wales operations had also been stripped out of FNW due to Welsh devolution and the creation of a single Wales rail operator, the left overs (the local routes around Manchester, Liverpool, Lancashire & Cumbria) were merged with the left overs from the opposite side of the Pennines.
This created the “zero-growth” Northern franchise of 2004.
However, this wasn’t a unified company, it effectively had two separate halves, an “East Side” and a “West Side”, divided by the Pennines. Each had it’s own trains, and it’s own train crew. More importantly, the terms and conditions of East Side and West Side employees remained as previously – correctly protected by TUPE – but they were never harmonised with the passage of time.
That is a situation that has persisted to this day.
This was complicated further by the 2016 franchise change which took a number of TPE routes and transferred them (and the folk that work them) back into the Northern franchise. This included drivers at depots such as Blackpool and Barrow. These drivers find themselves working once again for Northern, but as their employment was protected by TUPE, their terms and conditions are different again from other Northern “West” drivers.
Northern have ended up with a fragmented workforce, with multiple different contracts, and different terms and conditions.
Furthermore, the railway is still run as two separate halves in terms of traction and train services. Services are either “East side” or “West side”.
This shows in the quality and types of rolling stock deployed in the various areas.
While some trains are obviously captive to their local areas, such as the electric units (Class 323s around Manchester and Class 333 on the Airedale routes), the diesel units are split such that the lion’s share of the more modern units (e.g. air conditioned Class 158 units) are allocated to the East side, while the West side has a greater proportion of older units such as 150/1 and the non-air conditioned Class 156.
This was a significant sea-change on routes such as Blackpool-Manchester which used to enjoy a number of modern air conditioned Class 175 units under First North Western, then Class 185 units when the service passed to Transpennine, but have more recently been served by a mix of the dreaded Pacers, or the older Class 150 or 156 units.
In the cascade of rolling stock, the newer Class 170 units from Scotland being transferred to Northern will also appear to be focused on East Side services.
Conspiracy theorists might suggest that with Northern Rail HQ being in York, this division of resources is somewhat intentional, ensuring the East side operations have the newer and notionally better units!
However this is more likely to be a habit that persists from the British Rail days. Aside from the premier services such as the WCML expresses, the North West has long had to make do with the leftovers and hand-me-downs.
The longer distance and more “premium” services in the North of England (e.g. North & South Trans-Pennine) had historically always been operated by the Eastern Region out of York, with Eastern Region locomotives and rolling stock (something which persisted through to creation of the Transpennine Express franchise). Services run by the Midland Region tended to be shorter distance, potentially slower, more locally focused, and so tended to get the less modern stock.
I’m not saying the local operations in the North West never received stock from new – a good number of Pacers and Class 150/2 “Sprinter” units were allocated here on delivery, but as part of a wider scheme where new trains were rolled out across the BR regional fleet.
So, really, who IS responsible for the mess?
The Rail industry as a whole bears some level of responsibility for this perfect storm, and I extend this to include the relevant bits of Whitehall.
The operators have done the best that they could with a deck that has been stacked against them by vacillating transport strategy coming out of Governments and the DfT.
Franchise re-carves and reshuffles, on-off electrification schemes, no-growth franchise plans, interference in rolling stock distribution.
Pressure from Whitehall to do less with more. This is particularly evident for Network Rail who were told to reduce costs in their train planning functions, which happened, but then led them into attempting one of the most widespread and comprehensive timetable recasts in probably 30 years with an under-resourced planning & timetabling department.
The fact is that successive Governments have manipulated rail investment as a political tool to win votes, rather than having a long-term strategy.
Want to win an election? Promise to electrify. Win the election? “Oh, sorry, that electrification? It’s indefinitely postponed now.” Meanwhile, money is poured into “shiny” schemes.
The lack of a consistent and coherent rail strategy has created such uncertainty for the industry, such that when decisions are made, they seem more like tactical ones, as opposed to long-term strategy.
Furthermore, the fractured nature of the rail industry seems to mean that no-one is prepared to take the tough “executive level” decisions – such as the one which could have allowed operators to roll-forward the pre-May 2018 timetable until the required infrastructure improvements had been turned over, and the rolling stock cascade was assured.
My opinion is that an even bigger storm coming, and no-one is steering the ship.
The past 14 days have been a torrid time for the North’s rail commuters – widespread cancellations, heavy delays, overcrowding, short-formed trains with fewer coaches than planned, and timetable changes that have made some journeys longer rather than shorter, or even no-longer possible.
The alleged cause is the rollout of a new timetable on 20th May which was intended to exploit recently electrified routes, and a new piece of railway in the Manchester Area, the Ordsall Chord. It was intended to help increase capacity on some key routes, and increase some through journey opportunities.
However the results have been quite the opposite.
A Brief History Lesson
For a long time, Manchester’s railways were basically broken up into a North network, centred around Victoria, and a South network, focused on Piccadilly. Drivers and Guards were similarly split, and so a driver from the North Manchester network (whether they were based at Victoria, or further out such as Wigan, Preston or Blackpool) didn’t have need to know the routes of the South network, and vice versa, because their trains didn’t go there.
Drivers and Guards knew the various routes which connected the two parts of the network, for the rare number of trains which crossed between them (mostly empty carriage moves), but that was all.
This changed in 1988 with the opening of the Windsor Link – this bridged the network from the North West of Manchester – the lines from Wigan, Bolton and Preston – with the lines into Manchester Piccadilly. It was part of the fulfilment of a long held ambition of the city to reduce the need for passengers to shuffle between Piccadilly and Victoria, the other being the opening of the Metrolink system in 1992.
This emphasised the importance of Piccadilly as Manchester’s primary station, and a significant number of trains were switched over from using Victoria over the years following the link opening. Coupled with the Metrolink taking over the Bury line, this facilitated the downsizing of Victoria from the enormous 17 platform station into the smaller 6 platform station of today, and the construction of the Manchester Arena over the remainder of the Victoria site. This was also against a backdrop of rail travel falling in popularity since the 1960s.
The Windsor Link, concentration of primary services in Piccadilly, and reduction of Victoria to a secondary station was planned against these expectations, rather than the burgeoning demand we see now, 30 years later.
Oxford Road becomes “edge of the world” for some Train Crew
For operational convenience, when the Windsor Link became operational, many services from the North side of Manchester were joined up with those from the South side. From a marketing perspective, this facilitated new “through journey opportunities”, with no need for a passenger to change train, or only change once – though actually these seemed to be of niche value (e.g. Blackpool to Buxton, or Wigan to Chester via Stockport) and seldom exploited until the opening of the line to Manchester Airport in 1993.
The through working also helped the operational railway boost rolling stock utilisation, as trains spent less time “turning around” at Piccadilly and Victoria.
However, some of the Train Crew remained quite firmly “North” and “South”, and where this was the case they changed crew over at Oxford Road if the train was to cross or had crossed the Windsor Link. This is an important point, as this arrangement somewhat persists through to the present day for a number of trains. It has changed somewhat over time with the addition of the line to Manchester Airport which opened in 1993, and some “classically North” depots such as Wigan did (and I believe still do) sign routes as far South as Crewe via Wilmslow, while “South” depots such as Buxton know the way to Blackpool North, but there are still a number of crew changes needed at Oxford Road, even today.
This 30 year old legacy explains why there have been numerous reports of all the platforms being blocked by trains waiting for relieving crew at Oxford Road.
Uncontainable Damage
The other thing that the Windsor Link enabled is for delays and cancellations to spread between the previously separated North and South networks.
Even if a train appeared to the passenger to only operate in the North network (e.g. Bolton to Manchester Victoria), the coaches could have worked in a disrupted South network earlier in the day, or have become delayed behind some other late running service off the South network.
Previously, reactionary delays could be relatively well contained to the side of the network that the root-cause originated on.
The addition of the Ordsall Curve now allows delays and cancellations from the North East of Manchester to spread toward Piccadilly and the South network, in the same way the Windsor Link allowed this to happen with the North network.
So this means it’s important to have plans and procedures in place to contain the spread of disruption to what would be otherwise unaffected lines, or minimise reactionary issues.
What do I mean by that? A good example could be a passenger left confused as to why their Preston to Blackpool train is cancelled because of snow in the Peak District. To the railway operator, this makes sense, because the train started in Buxton and discovered a snow drift near Whaley Bridge. But to the passenger on Preston station, they don’t really understand why it should disrupt them, and nor should they need to.
Slip Sliding Away: Hobbled by Hand-me-downs
The long-awaited electrification of lines in the North West of England is finally happening, some would say over 40 years overdue. Why it wasn’t done as a “follow-on” project to the WCML electrification to Glasgow in 1974 is a question for the politicians of that era.
With the extra overhead wires comes a fleet of “new” trains – except they aren’t really new, they are “cascaded” from their previous sphere of operation to the North West, given a lick of paint and a tidy up. These are the Class 319 “Northern Electrics” – based on a 1980’s design. These trains were up until recently used on the Thameslink network around London, where again they were largely inadequate for the work they needed to do, and built by BR on a limited budget, thanks to a Government who’s usual reply regarding investment in rolling stock was “You need three trains, but you can only have the money for two.”
The biggest problem with the Class 319 units seems to be they simply can’t keep time on schedules which contain a number of station calls. This is demonstrated by their introduction on the Manchester to Crewe local trains with the timetable change. These contain frequent stops, and the timekeeping is poor. Here the Class 319s actually replaced newer and more advanced Class 323 units, which were proven on the route.
The big difference between the Class 319 and the Class 323 (or a Class 319 and a diesel unit) is the rail equivalent of “rubber on the road”.
In the Class 319, all the traction equipment, and all the powered wheels, are situated under a single coach – one of the two middle coaches. This gives the train 4 powered axles for a 4-coach train, compared to the 323 where it’s the two end (Driving) coaches which contain the powered axles – giving a total of 8 powered axles for just 3 coaches on the 323. In this respect, the 323 is already superior in poor rail conditions by having the driven axles more evenly distributed along the train. That’s without the more advanced features of the Class 323 such as better wheelslip control and regenerative braking.
Even on a 2-car diesel unit, the power is more distributed, there being a total of four driven axles spread throughout – one powered axle on each bogie.
Basically, the Class 319 has long suffered from problems with rail adhesion, even when used in the South of the country.
The unit is basically unsuited to the frequently damp conditions found in the North West of England and frequent stops and starts.
It may be able to keep time on more “express” level journeys, such as Manchester to Blackpool via Wigan, but it presently seems a dubious performer on all-stations work. Things may improve as staff gain handling experience, but it’s doubtful.
This is a situation which may only get worse as Northern were planning to release all their Class 323 trains back to the leasing company at the end of 2018.
Squeezing a Quart into a Pint Pot
This is happening on a number of fronts.
Firstly, infrastructure.
The Ordsall Chord helps in some respects – it removes some of the criss-crossing of trains across the main station throat just south of Manchester Piccadilly. Since the timetable change, fewer trains cross all the way from one side to the other – several of these were TransPennine Express trains between Manchester Airport and the line to Huddersfield, Leeds and beyond. These trains now operate through Oxford Road, take the Ordsall Chord to Victoria, then route up Miles Platting bank and via Ashton to regain the route at Stalybridge – in effect back to “classic” North TransPennine route.
However this does increase some pressure on the the twin-tracked section between Manchester Piccadilly’s platforms 13 and 14, through Oxford Road to Deansgate. At Piccadilly, as there are only two platforms, this limits trains to a bare-minimum of a 4 minute headway – that’s how long is allowed for a train to slow down, arrive at Platform 13 or 14 at Piccadilly, unload and load passengers, and depart. Realistically, this allows a maximum of 12 trains per hour between Piccadilly and Oxford Road if and only if everything is running on time.
This is also why some services from the Deansgate direction are planned to terminate at Oxford Road. There isn’t the space for them on the infrastructure further along.
Secondly, planning.
A number of the detailed working timetables for this timetable change were not available until very late in the day. This is because Network Rail are reportedly under-resourced in the train planning department, especially when a significant “recast” of the plan is requested, as with this timetable change, caused by the delays in completion of the various North West Electrification schemes – Blackpool to Preston was handed back late, and Euxton Jn to Bolton remains incomplete.
Also, the planning on the part of Northern seems to have gone awry. They don’t appear to have enough Drivers or Guards available to provide the booked service, even if they work those they do have as intensely as possible.
Thirdly, Train Crew.
Shortages here seem to be the major cause of the cancellations since the introduction of the new timetable. Part of the reason is that Northern are trying do more, but with the same number of people. It was part of their franchise bid, that they could deliver these new services with no significant increase in the train crew complement.
It’s a common mantra in a lot of companies, you may hear it in your own workplace.
However the fact is that a train driver can only be one place at once. To squeeze the extra trains out, Northern Train Crew diagrammers have had to work the existing crews harder. This has meant cutting back on allowances built into the crew diagrams to handle out-of-course situations – for instance where a driver might get relieved from one train, and have 20 to 30 minutes to wait for their next train, maybe now they only have a few minutes between their trains. Of course, you can now see how if the incoming train is late, the driver might be delayed getting to their next booked train, which then departs late. Eventually this will have reactionary effects with crews and trains out of position.
The other issue which may also be rearing it’s ugly head is route knowledge. We’re back to the Oxford Road “boundary” thing again, for instance the Liverpool Lime St – Crewe trains have to change crew at Oxford Road, as Liverpool drivers don’t know the route to Crewe, while Manchester Picc drivers don’t know the route to Liverpool via Chat Moss.
Employee relations also play a role here. If you think your relationship with Northern as a passenger is currently bad, don’t think it’s all rosy for the employees either. I believe there is currently no valid Rest Day Working agreement in place between the drivers’ union (ASLEF) and Northern.
For a long time, it’s been common for Train Crew members to work some of their days off (Rest Days in rail-speak) to cover for colleagues who were unable to do their booked duty. Maybe it’s due to holidays, sickness, or sometimes it’s because they are at work, but it’s their turn to be in the classroom, learning new routes, learning new trains, or just part of their regular training and assessment processes to ensure they are competent and safe to do their job. It’s some welcome extra cash for the person covering the work, and it ensures service levels are maintained without having to employ too many standby or reserve staff. Sometimes a driver might work a Rest Day in order to attend training sessions.
The lack of an agreement for RDW is no-doubt partially behind the lack of Train Crew and in particular Drivers, and I’m almost certain that any negotiations will be a game of chicken and seeing who flinches first.
What could have been done differently?
The impression I get is that the various management entities, Network Rail, Northern, GTR down South, and even the DfT, chose to doggedly press ahead with rolling out this timetable when clearly there hadn’t been enough preparation, the planning was of dubious quality and appeared to have been rushed, while some things basically just weren’t ready – whether that’s infrastructure or driver training – to deliver the new timetable.
What would have been the most sensible thing to do in these circumstances would be to delay rolling out the new timetable, probably by 8 to 12 weeks, and instead extend the validity of the old timetable.
This has been done before, back in BR days. There was a similar significant change in timetabling and rolling stock disposition enabled by the East Coast Main Line electrification in 1991. The May 1991 timetable change was to herald introduction of electric services to Edinburgh and the cascade of a number of HSTs to cover more “Cross Country” work – i.e. those Intercity services which avoided London.
However, because of the tightly-coupled nature of the various projects, things weren’t ready. The decision was taken by BR to extend the validity of the 1990 timetable through to July, rather than take the risk of the sort of disruption we see now.
So there is a precedent for delaying rollout of a new timetable, however in the privatised railway, I suspect it is more complex than in the days of BR.
Finally, lightning does strike twice!
Remember we started with the Windsor Link?
The 1989 timetable which brought that line into full use became known as the “timetable that failed” to the operators. The service collapsed then for several similar reasons, in particular the over-dependence on good time keeping and maintaining planned station dwell times to keep the core Piccadilly – Castlefield section moving, and little in the way of wiggle room for recovery. Sound familiar?
How was that solved? Basically shifting more services back to Victoria and reducing some of the off-peak services in order to provide a “fire-break” between the morning and evening peaks.
Neither will work in this case – Victoria doesn’t have much spare capacity, the station being massively reduced in size since the early 90s, and there is little scope for reducing service, as many of the paths over the congested Piccadilly – Castlefield section are provided by other operators, such as TransPennine or East Midlands Trains, or used by freight trains to access Trafford Park. They won’t want to give up paths.
It seems that very little in terms of lessons learned from the 1989 experience got applied in the development of the disastrous May 2018 timetable.
Finally, a bit of humour, because if we didn’t laugh, we’d cry…
Last week I suffered a frustrating experience at the hands of British Airways. None of the flights were late or cancelled, my luggage didn’t go missing. But there was a constant “drip, drip” of small niggles that were enough to take the shine off, and create an overall negative experience.
On my outbound journey to Johannesburg, I enjoyed a good airport experience, pleasant check-in agent, managed to snag a good-value upgrade to Business Class, had an easy passage through security and found a nice place to sit in the lounge.
When I boarded the plane, even before we set off, I pulled out the tray table so I could check a few things on my laptop. It was wet and sticky, there was a blob of some sort of sauce on it. Yuck. There was also some sticky residue on the seat surround and the armrest. As I look down to my feet, there are salt & pepper sachets left from a previous flight, tucked in a nook.
Despite the plane having been on the ground for five hours, it was obvious that there had been no attempt to actually clean the table or seat area.
Fortunately one of the crew responded quickly when I told them, and fetched some damp cloths. She and I cleaned the dirt up together.
On the return trip, there were more niggles.
Firstly, the seat was dirty again. This time bright violet rings from spilled red wine on the side bins (this was upstairs on the A380). The toilet smelled pretty bad, of stale urine, even before takeoff, and we’ve got an 11 hour flight to go. Sadly, the aircraft had spent almost the same amount of time as the flight on the ground in Johannesburg, but it seems no attempt is made to use this long down-route layover to give the plane a good scrub.
I felt really lucky to have an empty seat next to me on the flight home, meaning I could spread out and get to the aisle without troubling a neighbour. But this was a double-edged sword when it came to cabin service.
I got passed over more than once and had to remind the crew I was there when they were serving drinks and food.
“Excuse me. Hi, I think you just skipped over me? Just some water, please.” A half-filled cup of water – probably about two mouthfuls – was thrust at me. I wasn’t offered any snacks, unlike my neighbours across the aisle, before the trolley scooted off.
There were other in flight service shortcomings on this flight as well.
On arrival back in London, having waited about 20 minutes in the baggage hall, a message comes over the PA that our checked baggage was trapped in the hold of the aircraft, but engineers had now managed to open it and bags should be arriving soon. It was another 10-15 minutes before the first bags arrived from our flight, and another 40-45 before my own bag put in an appearance. I had been waiting around an hour in the baggage hall.
My trip ended with a flight back home to Manchester later the same day after freshening up and attending some meetings in London.
On boarding that flight, there was a discarded sticker, bright high-vis orange, stuck on top of the armrest of my allocated seat. Obviously some charming previous occupant left it there, but it takes just a couple of seconds to peel off and throw away. So why wasn’t it?
But that wasn’t all. The inside pane of the window at my seat was loose – the beading around the window was not attached properly, but hanging off, and the inner window pane that it should retain in position had dropped, leaving a gap to the outer pane. Now I know it has nothing to do with the pressurisation of the plane, it’s part of the cabin trim rather than structural, but it still looked shoddy.
Then we were delayed leaving Heathrow because, according to the flight deck “the cargo department has left behind some trucks, blocking us on the stand”, and we had to wait around 10-15 minutes for those to be moved.
The final niggle for this trip came on arrival at Manchester when it took around 30 minutes to get hold luggage delivered to the belt, from the plane which must have only been 25-30 yards away: it must have taken all of 90 seconds to walk from the plane to the baggage reclaim belt, that close. The infuriating thing was the way the bags came in little trickles.
It was possible to see through the curtain at the end of the belt what was happening. A tug would arrive with a truck carrying a single baggage container. That would be unloaded onto the reclaim belt, about 15 bags or so. The tug would then drive off, returning around 10 minutes later with another single container with another 15-20 bags. My bag finally showed up on the third trip.
My point is that most of us were waiting for our bags for the same amount of time as the plane was in the air from Heathrow to Manchester.
It’s all well and good saying “Don’t check-in a bag” – but I had no choice on this occasion, both with the size of the bag and contents that couldn’t go in the cabin.
These were all little niggles that taken in isolation wouldn’t really seem like much of a problem. But when this is the experience of one individual on one journey, it feels like a drip, drip of problems that take the shine away. You begin to wonder if this is actually what “normal” looks like for a journey with British Airways?
To their credit, BA did try and communicate with me after I raised these points on social media.
However, that too was a disappointment. I ended up having a deeply frustrating phone-call with a member of the BA team that could only apologise and offer excuses, rather than give me reassurance or answers.
All the person could say is: “This shouldn’t have happened. This will be referred to the appropriate teams.”
Sadly, I’ve been told that before, but a dirty or defective cabin environment happens again and again.
I asked how it’s referred up the chain. It’s basically rolled up into some generalised stats, trends and metrics. Those who can directly drive change never get to see an end-to-end “story” of a negative experience.
No wonder these shortcomings never get corrected.
I appreciate the call was probably equally frustrating for the BA staffer too. They couldn’t answer my questions. They couldn’t reassure me that this wouldn’t happen again. All they could do was offer apologies which they also knew that I viewed as empty platitudes. In the end, I told the BA person that I wanted the complaint logged as 100% unresolved to my satisfaction and that I wanted to end the call.
Afterward, I asked myself what I wanted from the call. I wasn’t looking for Avios (BA’s frequent flyer currency) as “compensation”. I wanted BA to know they fell short, they underdelivered, and to feel heard not just as part of the wider BA passenger collective but acknowledged as an individual with their own story. I wanted BA to recognise the investment I’ve made in them by choosing to fly with them, and more than anything, I wanted them to show they had some pride. Instead I felt stone-walled.
Right now my biggest complaint has to be cabin cleanliness and maintenance. It seems to happen at least 50% of the time that I find myself sat in a dirty or somehow deficient or broken seat when travelling BA, especially long-haul.
I know this sounds like a “first world problem”, but at the end of the day BA are not a cheap airline. They are actually quite expensive, and having paid for a service, is it not fair to expect the basics to be delivered as advertised?
Don’t get me wrong, I’m not some sort of dirt-phobe, but by the simple expedient of saying “Sit in this dirty/broken environment for the next X hours” the message BA sends is that I’m disrespected as an individual. That it’s okay for me to have to sit in dirt, or have a bit of the product (e.g. leg rest or foot rest) not delivered as advertised.
The lackadaisical handling of the bags and blocking the plane in with cargo trucks sends the message “Your time is not important to us”.
These are surely the basics of an airline experience, that your airline is competent, that they get you from A to B, without undue delays, and that you aren’t transported in unpleasant conditions?
The best analogy I can draw is that if BA were a restaurant, my choice of food would come on a chipped, cracked plate, with an expectation to eat from it using a fork with congealed egg stuck between the tines.
So, my final word in this series, at least for now: My thoughts on what could have been done better, instead of suspending the network for so long.
Firstly, some opinion.
Sadly, I’m sceptical we’ll see any accountability or transparency from TfGM nor the Metrolink operator (KeolisAmey) about what could have been done better.
TfGM appears to be engaged in finger-pointing at their supplier:
“I’ve emphasised to the operator the absolute urgency in which they need to get services running” – Danny Vaughan, TfGM Head of Metrolink.
Meanwhile, the supplier, KeolisAmey Metrolink seem to be hiding behind a “cloak of safety”:
“We take customer safety seriously so the decision was taken to suspend all services.” – Aline Frantzen, Managing Director of KeolisAmey Metrolink.
This isn’t the first time that KeolisAmey senior staff have hidden themselves. Following the last network-wide failure in July they refused to speak to the local press, saying they were “busy dealing with the problem”: “Aline Frantzen, new Metrolink MD, and Alistair Gordon, chief executive of Keolis UK, were not available to speak to the M.E.N.”
These people are senior folks, and putting what I call “a face on a farce” is part of their job while their staff work behind the scenes to fix whatever’s broken. It’s not their job to hide.
Okay, that’s the opinion/minor rant over.
Now the fun bit. What could have been done better at 0830 last Friday morning…
Receive report from incident trams about what has happened. Assume the incident trams cannot be moved. It is also desirable to prevent other movements in the area to preserve evidence until the Incident Officer arrives. It’s fairly certain this is going to be a long one, and we still have people to get to work. We can’t just throw our hands in the air and cry “stop the job” for the whole network, even if we have no choice but to suspend service in the incident area.
The first 15 minutes:
A “line blocked” situation now exists between:
Exchange Square and Deansgate/Castlefield on 2CC, both directions.
Piccadilly Gardens junction and Deansgate/Castlefield on 1CC, both directions.
What’s left on the network that’s good?
Bury to Piccadilly via Market St
Rochdale to Victoria
Victoria to Exchange Square
Ashton to Piccadilly
All the South Manchester network up to Deansgate/Castlefield
Assumptions:
Drivers sign all routes so can operate trams to anywhere under direction of Control.
We can handle most issues with relieving/re-crewing/crew out of place, either by delaying breaks within legal limits, using alternative relief points, mobilising rostered spare drivers, and amending driver duties as required – the published plan is out of the window whatever now, anyway.
We don’t want to block running lines unnecessarily with reversing trams, as this causes knock-on delays – reverse in loops/sidings only where possible.
We can’t run non-ATS trams to Bury and Altrincham.
The network is effectively split in two pieces by the incident.
It’s the morning peak and the dominant flows are people heading into Central Manchester. We need to get trams as close into Central Manchester as we can.
Let’s look at the Northern part of the network first. This is actually going to be the easier one to maintain service on.
Bury – Piccadilly: This is completely unaffected by the incident and could keep going.
Bury – Altrincham: Can’t get past Market St.
Rochdale/Shaw – Didsbury: Can’t get past Exchange Square.
Ashton – Eccles: Can’t get past Piccadilly Gardens
Here’s how, immediately following the incident, the service could have been reformed to keep things moving:
Bury – Piccadilly: No change.
Bury – Altrincham: Continue from Market St via Piccadilly to Etihad Campus (maintains 6 minute headway between Piccadilly & Etihad).
Rochdale – Didsbury: Continue from Victoria via Piccadilly to Ashton, effectively taking over that end of the Eccles – Ashton service.
Shaw – Didsbury: Terminate at Exchange Square and reverse on crossover on Corporation St, return to Shaw.
Ashton – Eccles: Continue from Piccadilly Gardens via Market St to Victoria and thence to Rochdale.
We also need to get rid of any Piccadilly – MediaCity trams on this side of the blocked line as if we can’t usefully repurpose them to keep the other lines running, they are in the way. We can probably stable one in the Sheffield St turnback road, and send any more to Queens Road depot.
The above changes will keep the Northern half of the network moving. We’ve even a) theoretically preserved headway and capacity on the majority of those sections of route, and b) managed to do the right thing with the ATS fitted trams for the Bury line. The benefit of sending the Bury – Altrincham trams to Etihad also means when the line is clear and it’s time to re-form the service, we can send them forward from Etihad as Altrincham trams if we choose.
The Southern Network is more tricky as it’s more impacted by the incident. Except for the Airport – Deansgate tram, everything is going through the centre.
Firstly, nothing else can proceed beyond Deansgate until the incident site is cleared for operation. This could take a while.
There’s two ways we can turn trams around at Deansgate in this situation, one is in the centre platform, like the Airport trams usually do. The other is on the reversing crossing around the corner, on the viaduct up the side of Manchester Central – a tram arrives on the City Centre-bound or middle platform, unloads, departs to the crossover, reverses, and comes back on the Southbound platform to pick up passengers.
This still does limit how many trams we want running to Deansgate though. We certainly can’t support the close headway that is planned to run.
We need to thin the service down, and quickly, before it bottlenecks.
First thing would be to suspend the MediaCity – Piccadilly service, and run all Eccles trams via MediaCity to maintain service there. There are two double unit sized platforms at MediaCity, so we could berth two units there, and still leave one platform vacant for use by the remaining services, even if they happened to be formed of double units. We can also recess a couple of trams in the centre siding at Cornbrook.
Anything that’s already between Cornbrook and Deansgate is a done deal. We’re turning it around at Deansgate, whatever it is. Turn it around and send it back to the outer end of it’s route. Abandon even headwaying at this point, we just need to clear what’s between Cornbrook and Deansgate and get it back heading out of town – remember, there’s people using the network to head out of town too.
With the MediaCity service taken out, we have the following happening:
Didsbury line services approaching at 6 minute intervals
Airport line services approaching every 12 minutes
Altrincham line services approaching every 6 minutes
Eccles line services coming every 12 minutes.
So, that’s still a tram every 2 minutes, technically. Can it be done?
We know that during the Summer of 2016, they turned all routes around here during the blockade to finish and connect the new St Peter’s Square stop, and these were:
East Didsbury – Deansgate
Altrincham – Deansgate
Eccles – Deansgate
These all operated on 12 minute headways (the Airport line terminated at Cornbrook, as did half the Altrincham trams), which means a tram every 4 minutes, so half the trams we would be getting once we’d dropped out the MediaCity service.
I would suggest it cannot be done reliably and we need to reduce even further to prevent tailbacks on the viaduct at Castlefield.
If the Airport service is cut back to Cornbrook, which is a fairly normal technique used by control during congestion or problems between Cornbrook and the City Centre, that at least drops another movement out at Deansgate.
We’ve also got the Trafford Depot available if we have too many trams around and need to get some off the road, and this depot is readily accessible from all passing lines, without a need to perform any reversing or shunting – moves to and from the depot are straight-in/straight-out. We can also readily terminate or reverse trams approaching from Firswood or Old Trafford here if we need to relieve pressure in the Cornbrook area. It doesn’t help get people to work, but it helps prevent gridlocking if it seems like it’s a risk, and is an option.
Let’s assume we can take a tram every 3 minutes at Deansgate and turn it around using one or the other of the two techniques. That’s 4 trams every 12 minutes. We also want to try and make the best use of the double units we have, if we can. We can run the following service on the South side:
Didsbury – Deansgate every 6 minutes, mostly single, with some double trams
Altrincham – Deansgate, double trams, every 12 minutes
Eccles – Deansgate, single trams, every 12 minutes
Altrincham – Cornbrook, single trams, every 12 minutes
Airport – Cornbrook, single trams, every 12 minutes
So, that’s the system kept mostly moving for the first 30-60 minutes following the incident.
Once rush-hour has cleared, so from 0930, the sensible move would be to drop to a 12 minute headway on the South side while the network operates in a degraded state:
Didsbury – Deansgate every 12 minutes
Altrincham – Deansgate every 12 minutes
Eccles – Deansgate via MediaCity every 12 minutes
Airport – Cornbrook every 12 minutes.
We know this service pattern can be supported, we can easily take trams out of traffic from all directions at Trafford Depot, and berth trams at Altrincham.
We can consider redeployment of the released tram drivers as necessary as well.
Once St Peter’s Square could be re-opened to traffic on all lines except the line blocked by the incident, we can reform to the following, each on 12 min headways:
Bury – Altrincham via 2CC
Didsbury – Shaw via 2CC
Rochdale – Ashton via Market St
Bury – Etihad Campus
Altrincham – Deansgate
Eccles – Deansgate via MediaCity
Airport – Cornbrook
I accept this involves a reduction in headway on some South Side routes, but that’s because they are constrained, both in routes through the city centre, and where services can be turned around before the blockage.
The Northern part of the network and the Ashton line have maintained their advertised headways, the Ashton line maintains through services into Piccadilly Gardens rather than turfing everyone out at Piccadilly, and with a change at Victoria, passengers can access the South side of the network from there.
So that’s the network kept moving. People arriving at work maybe only 10/15 minutes late rather than 30-60 minutes late. People in Oldham not left wondering why they can’t get where they need to go because of an incident 10 miles away.
Why didn’t the above happen? I don’t know the answer.
The impression I get from an informed rider’s perspective of incident handling at Metrolink is that they cope reasonably well with routine issues affecting a single route, but if there is a major incident, their attention becomes turned wholly to the incident, rather than breaking the responsibilities of incident handling and service recovery up.
It feels like the disruption handling procedures and training may be out-dated, maybe written for a time when the network was much simpler and a 30-35tph service didn’t exist, or that there simply aren’t enough pre-rehearsed plans for service recovery, written up into “run-books”, that could be rapidly referred to and activated.
I’m honestly happy and willing to be corrected if these things do exist, but if they do, that then that raises the question of whether they are reviewed and audited regularly, and updated where necessary.
The message that was sent last week by suspending service for 30-60 minutes network wide is “We currently have no plan for this” regardless of whether that is really the case.
Media reports in the last week state that there will be a RAIB investigation into the collision between the two trams. I don’t believe that anything I’ve written here is in any way directly related to the collision, but more the operator’s response to reforming the service in response to the reactionary effects of the incident. I don’t believe any of the above is prejudicial to the RAIB investigation.
Despite looking alike, not all of Metrolink’s trams are created equal.
This is because Metrolink has: Two Different Signalling Systems
When Metrolink was built initially, and the Altrincham and Bury lines were converted from British Rail operations, it used a railway style signalling system, and part of this is a safety system called ATS fitted to the trams. The plan when the system was expanded in the 2000s was to replace the railway style signalling on the Bury and Altrincham lines with a tram/metro signalling (known in Manchester as “TMS”) coupled with “line of sight” driving, which is being used on the new-build lines to Ashton, East Didsbury, Manchester Airport, and the converted railway line to Rochdale via Oldham. This system doesn’t require ATS.
The majority of the network is now on the newer system, but parts of the Bury Line remain unconverted, as is the section between Timperley and Altrincham Station, which is currently controlled from the Network Rail signalbox on Deansgate Lane, by Navigation Road station. These require use of the ATS fitted trams, which can go anywhere on the network.
Not all the trams are fitted with ATS: only half of them are (the ones numbered 3060 and below, if you’re interested). Therefore these are rostered to work on the lines that require them first (Bury-Picc, Bury-Altrincham, Altrincham-Etihad), but also can appear on other lines, as not all the ATS trams available are needed to operate the Altrincham and Bury services.
The other 50% of the fleet doesn’t have ATS and so can’t operate in the areas with the older signalling. This means they only work on the Ashton, Eccles, Rochdale, Didsbury and Airport lines.
Therefore it’s not necessarily possible to just take a tram that started out in Eccles that was going to Ashton, send it round the 2CC and run it onward to Bury, as that’s likely to be a non-ATS tram.
So there are only two places that a non-ATS tram could be sent once diverted via 2CC to Victoria: either to continue up via Oldham to Shaw or all the way to Rochdale, or empty out at Victoria and run empty to Queens Road.
The decision was taken not to fit the whole fleet with ATS because the plan is to phase it out completely. It seemed a sensible and rational decision at the time.
There are works in progress to convert the Bury line to line-of-sight with TMS signalling, but they are yet to be finished. I’m not entirely sure what the longer term plan is with signalling on Timperley-Altrincham.
This adds another level of complexity for the controllers to manage.
Got Amps?
The other issue to consider even if it’s possible to divert the displaced trams to other lines is whether there is sufficient power available to handle the extra demand placed by the additional trams.
The overhead power lines are split into sections, so that they can be de-energised for maintenance, be fed from different parts of the power grid to help localise impact of mains supply interruptions, and more importantly manage the power loads imposed by the trams.
Control need to be careful that trams don’t just run willy-nilly into the same power supply section, or it can overload the power supply and cause even worse disruption, so that needs to be taken into consideration in those parts of the network which have constraints.
It is therefore necessary to regulate the service to ensure that this bunching up of the trams doesn’t happen, because not only can it cause issues on the power supplies, but it can cause congestion on both the tram network itself, and road congestion in areas with street running.
However, neither of these feel like good enough reasons why the entire network needed to be brought to a halt for over half an hour during the peak period.
Next time, I’ll write about what I believe could have been done to minimise the impact to services and not stop the entire network in the middle of rush-hour.
In the opening post in this series, I put forward a series of probably common questions as to why it took so long to recover service following the Metrolink disruption on 10th November:
Why couldn’t the trams be diverted via 2CC?
Why couldn’t the trams be turned around short of the destination?
Why couldn’t the trams just run to a different destination?
Why was the Bury-Piccadilly service, which doesn’t go anywhere near the incident, stopped?
Let’s take the first of these:
Why couldn’t some trams be diverted via 2CC (the Second City Crossing)?
Once it was ascertained that the incident was only affecting one line, the one which fed trams from St Peter’s Square toward Piccadilly Gardens, then you would think it becomes feasible to divert the approaching City-bound trams from Deansgate via 2CC, taking them “off-route”.
The problem arises with what you do with them once they reach the other side of the City Centre.
It is very difficult for a Piccadilly, Etihad or Ashton-bound tram to regain the booked line of route, as there is no easy way from the far end of 2CC to head back in to town via Market St. There is no direct link between 2CC and this line without reversing direction.
So, the route via 2CC becomes an easy option for the existing Altrincham-Bury services, but that’s largely it without a more complex operation.
It’s also likely that routing all the trams down the 2CC would cause road congestion as well, as Cross Street is a shared right of way between trams and road traffic. So it becomes necessary to “thin out” the service.
Once the trams get to Victoria you have to do something with them, either turning them short of destination, reversing them, or doing something else with them, such as taking them out of traffic and running them to depot.
This leads us nicely onto…
Limited Places to turnback or “recess” trams
While Metrolink has a number of emergency turnback crossings which can be used to maintain service during periods of disruption, these effectively block the line while the driver changes from one end of the tram to the other, then receives a slot to cross over to the other line and return in the opposite direction. A queue of trams could quickly build up if this happened along a busy section of line. Some of these are also “unsignalled moves” so are only useable under very specific circumstances.
Besides the outer ends of the network, there are some specific turnback locations which have extra platforms or sidings to cater for reversing trams:
Timperley – has a siding so a Southbound tram can turn around and return toward the City Centre. This is most commonly used when trams can’t operate on the Network Rail managed section between Timperley and Altrincham, but is occasionally used to manage late running.
Cornbrook – there is a long centre siding here, this was until recently the usual terminus for the Airport Line, it can hold a good number of trams, and is useful during emergencies, both for recessing trams and reversing trams approaching the City Centre.
Deansgate – there is a centre platform which is bi-directionally signalled – that is trams can arrive and depart in either direction and reverse. It is currently regularly used for reversing the Airport service.
Piccadilly (Sheffield Street) – outside the back wall of Piccadilly station undercroft this has a centre track for reversing trams that have arrived from the City Centre and sending them back into Piccadilly station and thence toward Piccadilly Gardens. This is normally used for reversing two services, MediaCity-Piccadilly and Bury-Piccadilly. There are a further pair of crossovers in the “tunnel” underneath Piccadilly Station, these are most commonly used for reversing a tram from the Ashton direction and sending it back that way.
Etihad Campus – there is a long reversing track between the Etihad and Velopark stations. This is normally used for reversing trams on the Altrincham-Etihad service.
Shaw & Crompton – there is one dead-end platform as well as the two through platforms. This is normally used for reversing trams on the Didsbury-Shaw services.
What’s clear to see is that except for Shaw there are no dedicated reversing loops on the Northern side of the City Centre.
That means there’s nowhere convenient to reverse trams without blocking the line to “through traffic”, which causes more delays.
“But what about that third platform at Victoria, the one in the middle?” I hear you ask.
Regular users of the network will be used to this “white elephant”. Installed during the recent Victoria redevelopment, it has rarely been used. I believe it may have been used on one or two occasions during some planned engineering works, but it otherwise sits there, and is never used in normal service. There are even “Tensabarriers” across the centre tracks here, that’s how unused it is.
If this was operational during Friday’s incident then diverting Eccles-Ashton or Altrincham-Etihad trams via 2CC, reversing at Victoria then running via Market St, and regaining their booked route at Piccadilly Gardens might have been possible, but it wasn’t.
There might be very good reasons why it is not used, but these are not shared with us mere mortals. Instead it sits there as an embarrassment.
Trams from the South of the city which are currently shown as terminating at Victoria actually run empty to Queens Road after emptying out – there they have to reverse direction on one of the main lines, either to return South or enter the tram depot at Queens Road. There is no shunting line or reversing siding provided to do this move, and limited space to build one even if there was funding to do it.
There used to be a reversing siding just outside Victoria that would have been useful, but I also believe that to be disconnected/decommissioned and not available for use.
So, in spite of the additional flexibility added by 2CC, there are still some fairly significant constraints facing the controllers, and a big risk of trams backing up.
The redevelopment work for Crumpsall station will provide a new “turnback” facility, which will normally be used as part of the new Trafford Park service, but again provides Metrolink controllers with another useful option on the Northern side of the network when handling disruption.
Anyway, that’s enough for today.
Next time, we’ll find out that despite looking the same not all Manchester trams are equal, and maybe a word or two on power.